Day 16 – What Patterns Do You See?
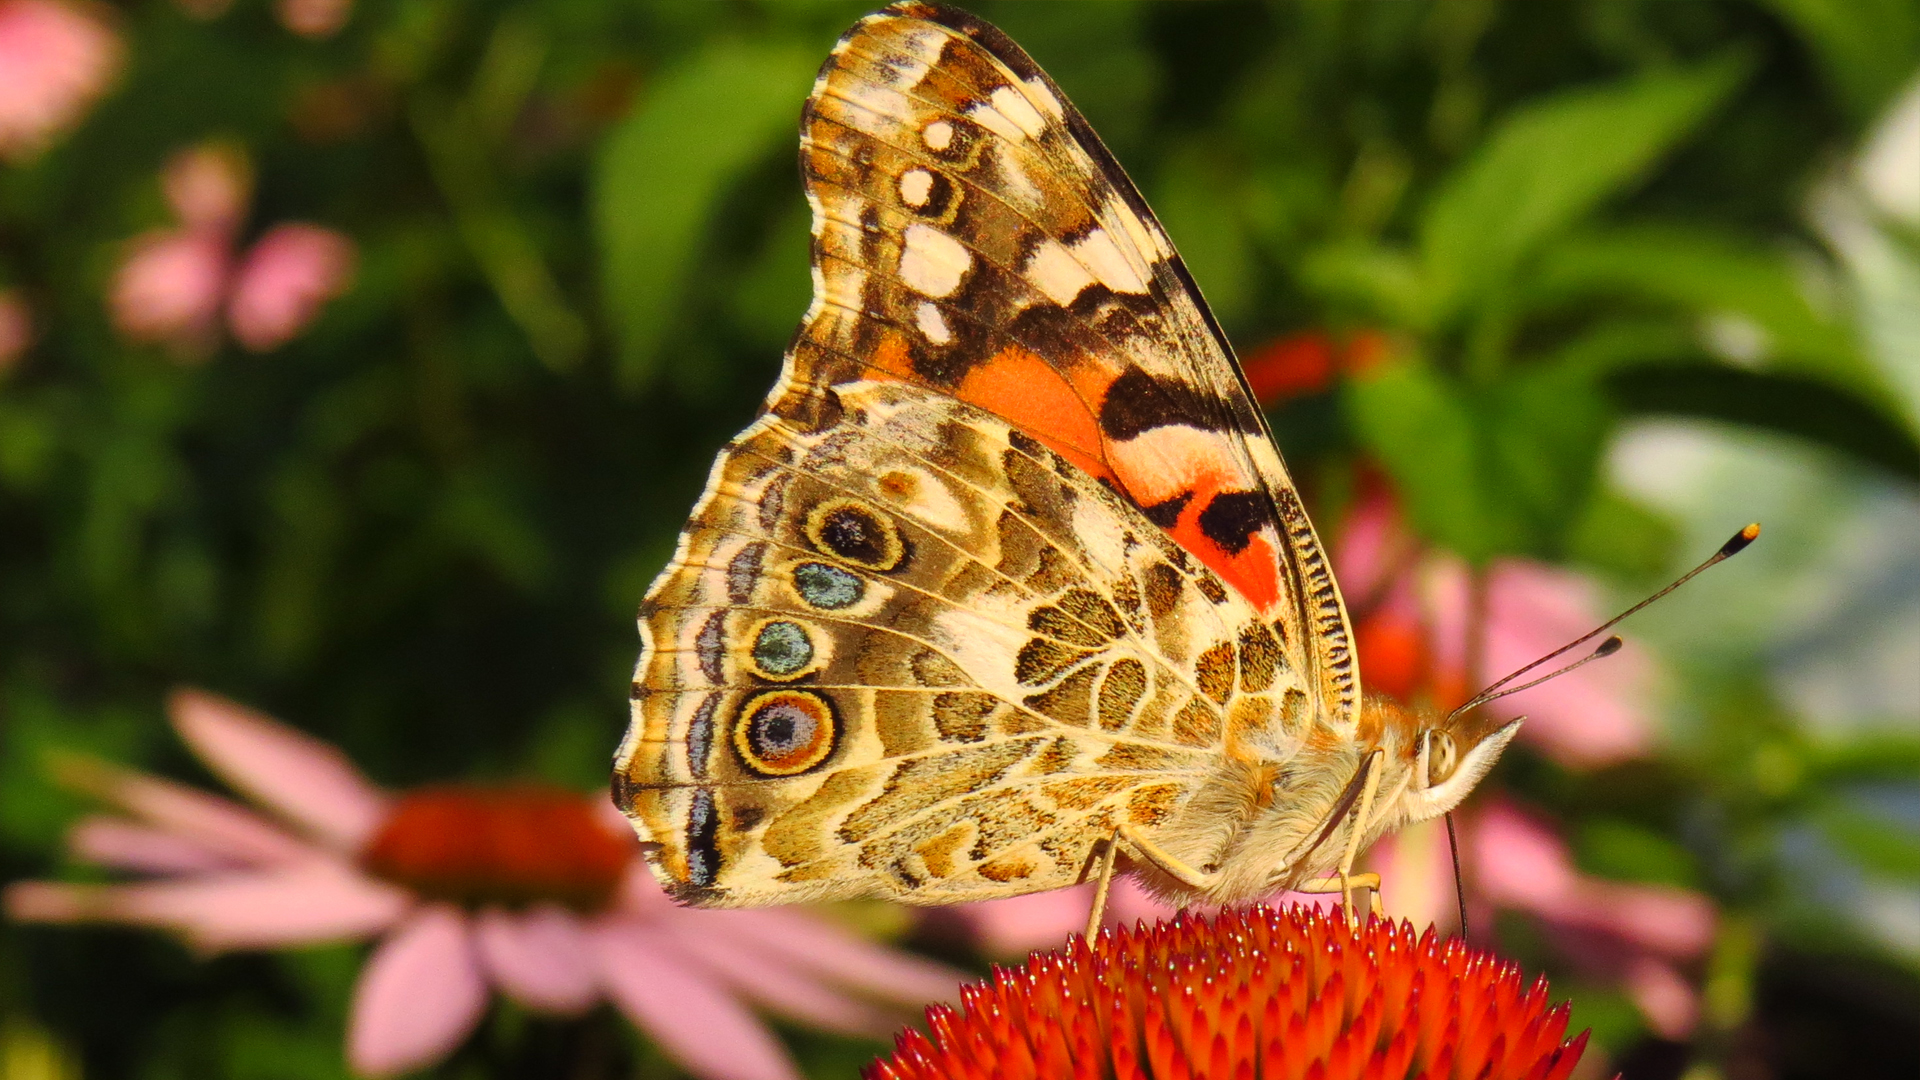
Painted lady butterfly showing its ventral wing pattern (underside) © Labbradolci. CC-BY-NC 2.0.
The patterns on dorsal and ventral surfaces of butterflies are typically different because they have evolved different functions. The ventral side (underneath) is often used for camouflage and predator avoidance, when the butterfly is resting. The usually brighter, dorsal side (top) is used for signaling and finding a mate. Wing patterns and colors are controlled by a master gene, WntA.
Standards Overview
Reading Strategy:
Synthesizing Mini-lesson Practice (Whole Group Statement)
Science Concept:
Inherited Butterfly Wing Traits
Reading TEKS:
2.6H
Science TEKS:
2.1(D); 2.10(D); 2.2(E)
Figure 19:
Reading/Comprehension Skills F
ELPS:
Reading 2-12, 19 TAC 74.4(c)(4)
Materials for Reading Mini Lesson:
Chart paper, markers, butterfly inquiry chart, each group’s synthesis statement.
Materials for Inquiry Circle Groups:
Group inquiry charts, pencils, variety of nonfiction texts for each group, access to websites and online books.
Materials for Science Whole Group Lesson:
Team Caterpillar Growth Measurements Graph (one from each team), Science notebooks.
Content Vocabulary:
Data — Facts and statistics collected together for reference or analysis.
Scientific Poster Session — A presentation method that encourages scientific conversations by enabling students to observe and compare the results of an investigation as they explain their results and rotate around the room in small groups.
Science and Literacy Connection:
After concluding our research, we need to communicate all that we have discovered. We can do this by compiling our data into a graph and creating a synthesis statement.
Reading Mini-Lesson
OVERVIEW
For the three days dedicated to synthesis, it is suggested that you start with a whole group synthesis statement about butterflies, followed by inquiry circle groups creating their own synthesis statement. Last, facilitate a whole group discussion around all of the organisms to create a synthesis statement for the class.
TIME: 15 minutes
PROCEDURE
Explain the strategy:
Tell what the strategy is (declarative knowledge)
- Say something like, “Today we will continue to practice synthesizing the topics we have researched. Remember, synthesizing is combining information across our sources to create our own, new information.” Refer to the anchor chart previously made with the class, the butterfly synthesis statement, and inquiry circle group synthesis statements.
Tell when and why to use the strategy (conditional knowledge)
- Say something like, “We’ve been talking about how we synthesize because it helps to construct a deeper and broader meaning about our topics across resources. As a strategic reader, I synthesize when I find information from different books, online resources, experts, and videos. Today, we will also synthesize across the entire class’s research!”
Tell how to employ the strategy (procedural knowledge)
- Teachers are encouraged to share examples of students using this strategy from the day before. Say something like, “Mohamed’s group did a great job yesterday writing a synthesis statement. I was so impressed when they____.” Teachers also are encouraged to invite the groups to share with their peers (you may need to scaffold this and prepare the students for sharing beforehand.)
- When facilitating the whole group synthesis statement, say something like (while you model the strategy), “The first thing I will do is look at each group’s synthesis statement.” You may choose to have each group share orally while you scribe. Or, you may want to have each group write on a sentence strip that you can then place on chart paper.
- Say something like, “Then I will compare and contrast the important information from each of the synthesis statements.”
- Say something like, “Now, I need to think about what I know about this important information and if I can add something from my own schema that is not mentioned.” Be sure to write the whole class statement in a visible place for your class.
- Model the mini lesson (above) and create a synthesis statement about the unit.
The synthesis statement may be something like, “Organisms have different life cycles, but all organisms look like their parents because parents pass down their physical traits to their offspring. These traits help organisms survive.”
Remember that the concepts this unit has focused on are:
- Organisms have physical characteristics that help them survive.
- Offspring resemble their parents because adult organisms pass down their traits to their offspring.
- Organisms go through life cycle stages.
The synthesis statement you will write during this mini lesson should incorporate all of these concepts.
Inquiry Circle
OVERVIEW
Scientists work in teams when conducting research and experiments. Each day of this unit, students will work in inquiry circle groups while embodying the role of a scientist. They will do so by taking on roles of scientists in research by speaking like a scientist, reading liking a scientist, and writing like a scientist.
TIME: 30 minutes
PROCEDURE
Today’s whole class discussion and synthesis may take longer than 15 minutes allotted in the Mini-lesson. You may also need additional time today to have learners finish their own synthesis statements before you facilitate the whole class synthesis. Therefore, we suggest you use this time in a way that best meets the needs of your class.
Science Lesson
OVERVIEW
The students will be able to observe the growth graphs of other groups and draw conclusions about caterpillar growth from what they see.
TIME: 30 minutes
GUIDING QUESTIONS
What pattern do you see on the growth graphs? Why does this pattern exist?
BACKGROUND INFORMATION
A scientific poster session is a presentation method that enables students to present their results to other students who are circulating around the room. Divide each team into two small groups. Half of each team should stand by their posters to explain their results while the other group members circulate. Then, have the students switch roles so everyone is able to present and view other groups’ posters. This is an opportunity for students to compare their data with that of other groups, share their results with their peers, look at data in a new way, and embody the role of a scientist. The teacher’s role in a poster session is to facilitate conversations among students and encourage the use of scientific language. Posters can be taped to the wall or placed on student desks throughout the room. Be sure to allow ample room for students to move between posters.
SETUP
Ask each group to turn in their Team Caterpillar Growth Measurements Graph (the one they have been gluing yarn on every day) to you. Place these graphs around the room, leaving space for students to walk from one graph to the next.
MATERIALS
- Team Caterpillar Growth Measurements Graph (one from each team)
- Science notebooks
PROCEDURE
DAILY OBSERVATIONS
Give students time to observe their organisms (whether they are in the larva, pupa, or adult stage), take measurements of the larvae (if applicable), and record their observations in their science notebooks. Facilitate group discussions by asking questions like, “What did you notice?” “What has changed since the last time you observed your organisms?”
PROCEDURE
Engage
- Gather the class around the growth habitats. Ask them to describe the biggest changes they have seen in the larvae (growth?). Accept all responses.
- Bring the discussion around to the measurements they have been recording. Explain that the measurements they have collected are called data by scientists. Scientists use data to help them explain and support their ideas.
- Tell the students that they have been adding measurements to their growth graphs every day. This helps them to understand how much the larvae are growing. And just like scientists, they use the graphs to represent the data (measurements) they have collected!
- Remind the students that team work is important; scientists cannot work alone! They work with other scientists and community members by sharing their information and results.
- Sometimes scientists use poster sessions at meetings to share their results.
Explore
- Tell the students to open up a clean page in their notebooks and title it, “Class Caterpillar Growth Graphs.”
- Tell the students they will be engaging in a scientific poster session to observe and compare every group’s growth graph. Students will walk around the room to look at each others’ graph and listen to the student presenters explain their graphs.
- Ask students to take notes in their science notebooks regarding what they notice about the graphs. (Possible observations could include: how all of the graphs show that the caterpillars grew bigger; one group’s graph showed that their caterpillar grew faster than another group’s graph; one group’s caterpillar did not grow as big as another group’s, etc.).
- Provide the students with sentence stems that they can use when recording their notes. Possible sentence stems include, “I noticed…” “This graph is different because…” “I can conclude that this group’s caterpillar…” “These results show…” etc. Model or “think-aloud” how to record your observations in a science notebook if necessary.
- As students are rotating around the room to each graph, facilitate by asking questions like, “What do you notice?” “How is this graph the same as another group’s graph? Different?”
- Be sure to allow students to switch roles, so every student can present and view the posters of other groups.
Explain
- After the students have completed their poster session, have them come back to a whole group setting to discuss their observations.
- Have students turn and talk to discuss with a partner, and then share out as you ask questions like, “Did you notice a pattern in all of the graphs?” “Why is the length of yarn increasing each day?” “Did you notice anything different about some of the graphs?” “Was there a particular day that each group saw a big jump in growth?” “What can you conclude?”
Elaborate
- Ask students questions that encourage their predictions, like “How would the graphs look different if the caterpillars didn’t have enough to eat?” “What would have happened to your measurements if the caterpillars had remained in the larva stage for a few more days?”
- Ask students why it might be easier to analyze data on a graph rather than reading it in their notebooks. (It’s easier to see, you can see a pattern, etc.)
- Explain that scientists use graphs all the time to analyze their data, just like they did!
Evaluate
- Observe and listen to students as they rotate around the room. Are they using scientific language in their notes and conversations?
Expanded Standards
Reading TEKS:
2.6H. Comprehension skills: listening, speaking, reading, writing, and thinking using multiple texts. The student uses metacognitive skills to both develop and deepen comprehension of increasingly complex texts. The student is expected to: (H) synthesize information to create new understanding.
Figure 19:
Reading/Comprehension Skills F. Students use a flexible range of metacognitive reading skills in both assigned and independent reading to understand an author’s message. Students will continue to apply earlier standards with greater depth in increasingly more complex texts as they become self-directed, critical readers. The student is expected to (F) make connections to own experiences, to ideas in other texts, and to the larger community and discuss textual evidence.
ELPS:
Student Expectations for Reading 2-12, 19 TAC 74.4(c)(4). The student is expected to: (K) demonstrate English comprehension and expand reading skills by employing analytical skills such as evaluating written information and performing critical analyses commensurate with content area and grade-level needs.
Science TEKS:
2.1(D). Mathematical process standards. The student uses mathematical processes to acquire and demonstrate mathematical understanding. The student is expected to: (D) communicate mathematical ideas, reasoning, and their implications using multiple representations, including symbols, diagrams, graphs, and language as appropriate.
2.10(D). Data analysis. The student applies mathematical process standards to organize data to make it useful for interpreting information and solving problems. The student is expected to: (D) draw conclusions and make predictions from information in a graph.
2.2(E). Scientific investigation and reasoning. The student develops abilities necessary to do scientific inquiry in classroom and outdoor investigations. The student is expected to: (E) communicate observations and justify explanations using student-generated data from simple descriptive investigations.